C.1 - Sarasota Waterways - Map of our Waterway
Be prepared - know the area
Florida Latitude Longitude Map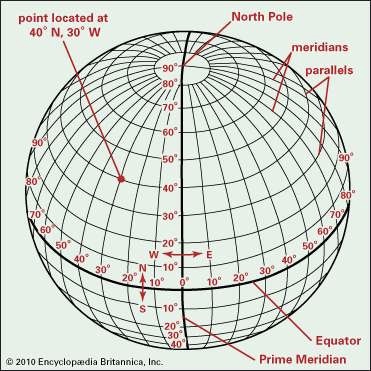
In navigation, to determine where you are in the world, you have to determine your latitude and longitude. The chart to the right illustrates how the world is measured based on latitude (North and South) and longitude (East and West). Using these numbers you can determine exactly where you are in the world.
The Florida Latitude Longitude Link will provide a more close up map of Florida with a table of each major Florida cities. For example, Sarasota is Latitude 27.34 and Longitude -82.55.
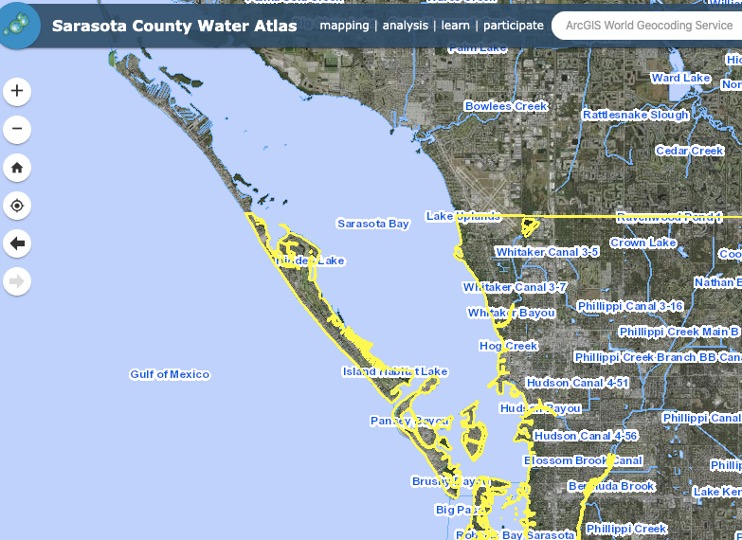
Water Atlas - The Sarasota County Water Atlas is an interactive tool lets you view mapped information about water resources as well as recreation, planning and infrastructure, habitats, and aerial imagery. You can also create and print your own custom maps. LINK TO: SARASOTA WATERATLAS
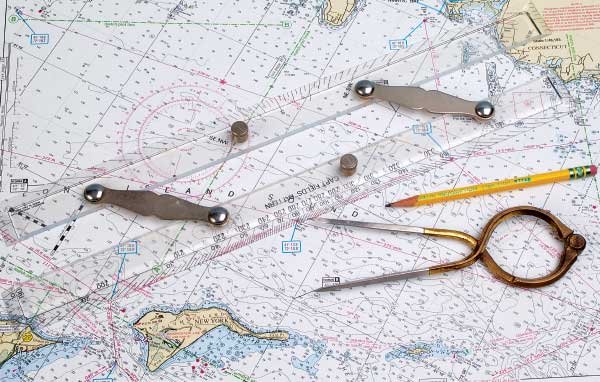
NOAA Chart 11425 - In order to help ensure your safety and enjoyment, you need to understand the areas you will be exploring. And to do that, you need a chart of the local waterway. This chart provides information about the navigational markers and the depth of the water. The Ocean Grafix chart that covers the Florida Gulf Coast from Tampa Bay to Charlotte Harbor is number 11425. LINK TO CHART 11425
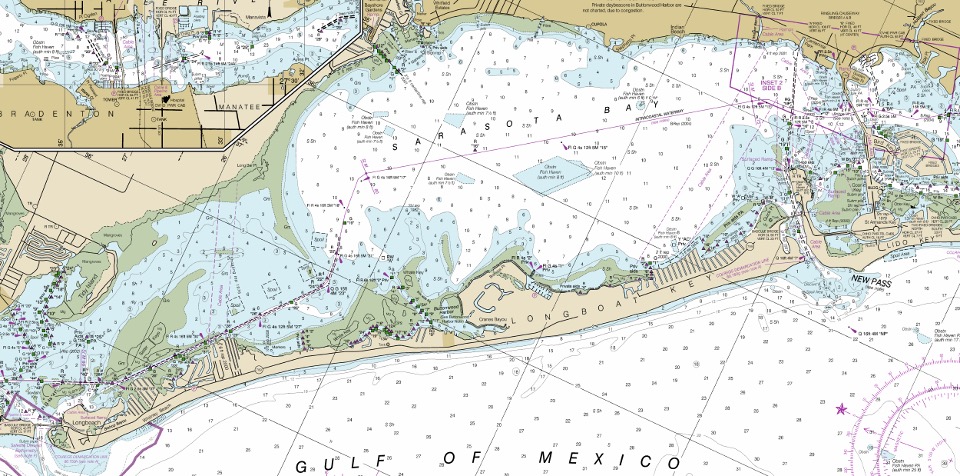
Water depths on the navigational chart may be in either feet or fathoms (the chart will indicate witch. A fathom is a nautical unit of measurement and is equal to six feet. The blue color indicates shallow and higher risk waterways and the white color indicates deeper and safer waterways.
On a chart, water depths may be connected with a line known as a depth contour, similar to the topographic lines or surface features that you see on a map. Depth contours present a picture of the bottom to the mariner.
In addition to showing water depths, a nautical chart also tells mariners about dangers to navigation, aids to navigation, anchorages, and other features. U.S. Chart No. 1 explains all the numbers and symbols found on both paper and electronic nautical charts.
Reading Navigational Charts
NOAA Chart 1 provides an explanation of all of the symbols on the nautical charts. You can download a PDF version from the NOAA website. LINK TO: NOAA CHART NO. 1
Nautical charts are identified by a five digit number. Sarasota's chart is 11425. Use the following link for a complete list of nautical charts. LINK TO NOAA Nautical Chart Catalog
Reading Charts - The following link provides an explanation of how to read nautical charts. LINK TO: HOW TO READ A CHART
Tides and Currents
The NOAA Tides and Currents website can give you current conditions about normal, abnormal, and higher risk water conditions in the areas you will be traveling. Taking the time to check these conditions may save you from avoidable problems. LINK TO NOAA TIDES AND CURRENTS
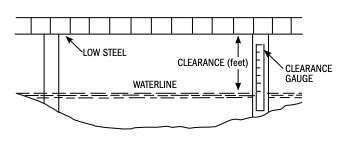
Water Levels
Water levels present significant risks to boaters. Unusually high waters may inhibit your ability to go under bridges. Unusually low waters can result in grounding your boat and having to be towed off. This situation may also occur in normal water levels, in areas that are naturally shallow. Experienced boaters have the ability to avoid these dangers, by reading navigational markers, following speed restrictions, using charts, knowing your vessel, and having and observing depth gauges.